Prometheus in Action
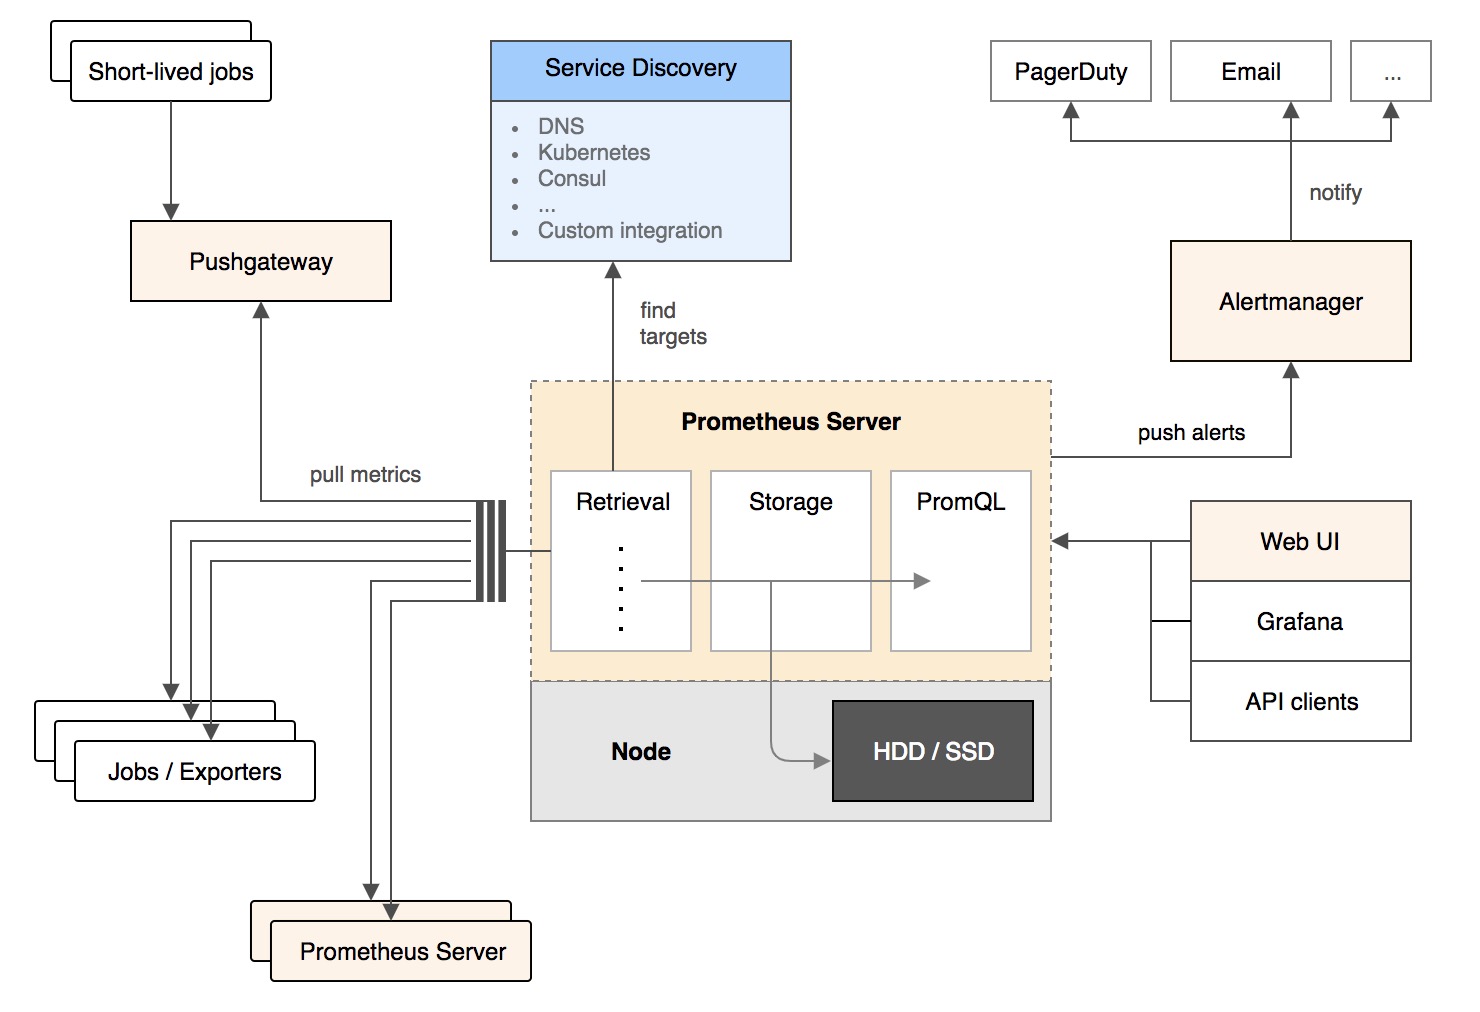
- 3 mins- Architecture Overview
- Configuring Prometheus to monitor itself
- Starting Prometheus
- Gather metrics
- Using the expression browser
- Expression language
- Using the graphing interface
- Starting up some sample targets
- Configuring Prometheus to monitor the sample targets
- Configure rules for aggregating scraped data into new time series
- Perfect Prometheus Config
- Reference
Power your metrics and alerting with a leading open-source monitoring solution.
Architecture Overview
Configuring Prometheus to monitor itself
prometheus.yml
Starting Prometheus
By default, Prometheus stores its database in ./data (flag –storage.tsdb.path).
./prometheus --config.file=prometheus.yml
Gather metrics
localhost:9090/metrics
Using the expression browser
localhost:9090/graph
Expression language
- prometheus_target_interval_length_seconds
- prometheus_target_interval_length_seconds{quantile=”0.99”}
- count(prometheus_target_interval_length_seconds)
Using the graphing interface
- rate(prometheus_tsdb_head_chunks_created_total[1m])
Starting up some sample targets
Download the Go client library for Prometheus and run three of these example processes:
# Fetch the client library code and compile example.
git clone https://github.com/prometheus/client_golang.git
cd client_golang/examples/random
go get -d
go build

# Start 3 example targets in separate terminals:
./random -listen-address=:8080
./random -listen-address=:8081
./random -listen-address=:8082
You should now have example targets listening on
http://localhost:8080/metrics
http://localhost:8081/metrics
http://localhost:8082/metrics
Configuring Prometheus to monitor the sample targets
Expose such as the rpc_durations_seconds metric
scrape_configs:
  - job_name: 'example-random'

    # Override the global default and scrape targets from this job every 5 seconds.
    scrape_interval: 5s

    static_configs:
      - targets: ['localhost:8080', 'localhost:8081']
        labels:
          group: 'production'

      - targets: ['localhost:8082']
        labels:
          group: 'canary'
Configure rules for aggregating scraped data into new time series
expression
avg(rate(rpc_durations_seconds_count[5m])) by (job, service)
prometheus.rules.yml
groups:
- name: example
  rules:
  - record: job_service:rpc_durations_seconds_count:avg_rate5m
    expr: avg(rate(rpc_durations_seconds_count[5m])) by (job, service)
Perfect Prometheus Config
global:
  scrape_interval:     15s # By default, scrape targets every 15 seconds.
  evaluation_interval: 15s # Evaluate rules every 15 seconds.

  # Attach these extra labels to all timeseries collected by this Prometheus instance.
  external_labels:
    monitor: 'codelab-monitor'

rule_files:
  - 'prometheus.rules.yml'

scrape_configs:
  - job_name: 'prometheus'

    # Override the global default and scrape targets from this job every 5 seconds.
    scrape_interval: 5s

    static_configs:
      - targets: ['localhost:9090']

  - job_name: 'example-random'

    # Override the global default and scrape targets from this job every 5 seconds.
    scrape_interval: 5s

    static_configs:
      - targets: ['localhost:8080', 'localhost:8081']
        labels:
          group: 'production'

      - targets: ['localhost:8082']
        labels:
          group: 'canary'
Expose metric name
job_service:rpc_durations_seconds_count:avg_rate5m